Services Performance Dashboard
The Problem
Currently, there is no visibility on the duration of specific operations that contribute to production downtime on the shop floor at the production site. Examples of such activities include standard procedures performed on machines, such as cleaning or changing parts.
To address this issue, I was tasked with investigating how we can track the actual time spent on these services. The goal is to evaluate any changes to the standard procedures and steps that can be modified to reduce downtime.
The Solution
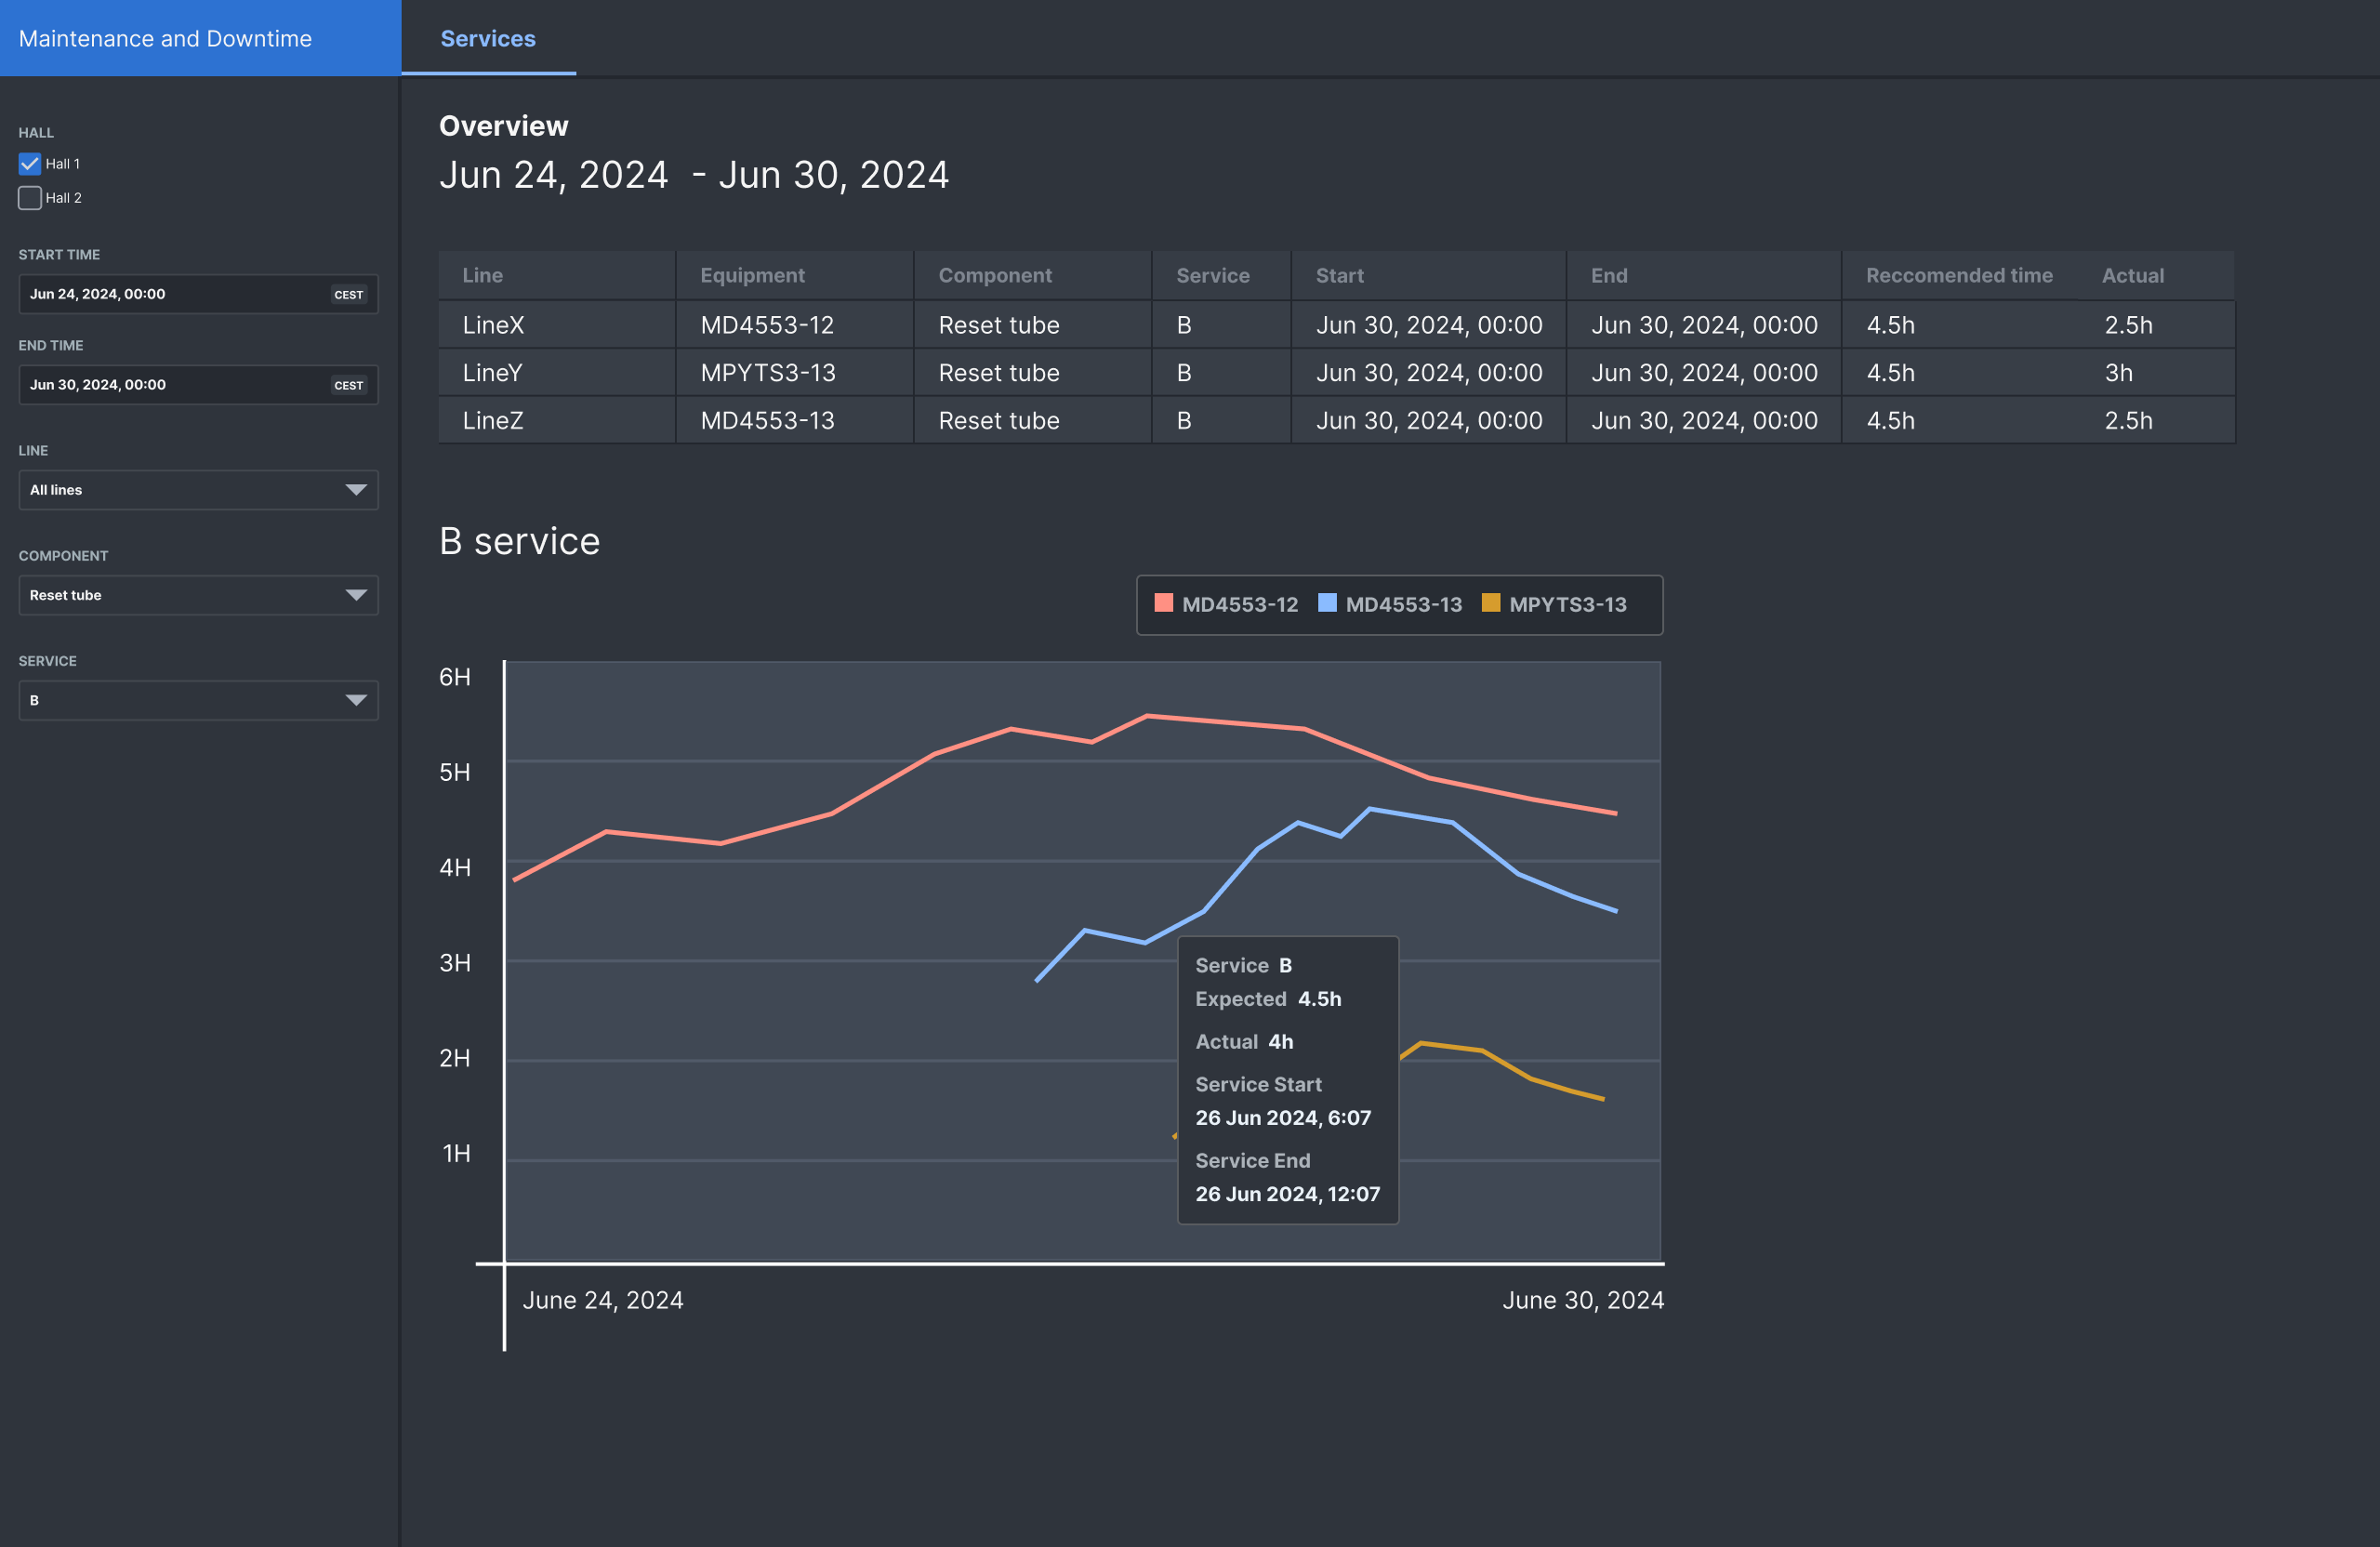
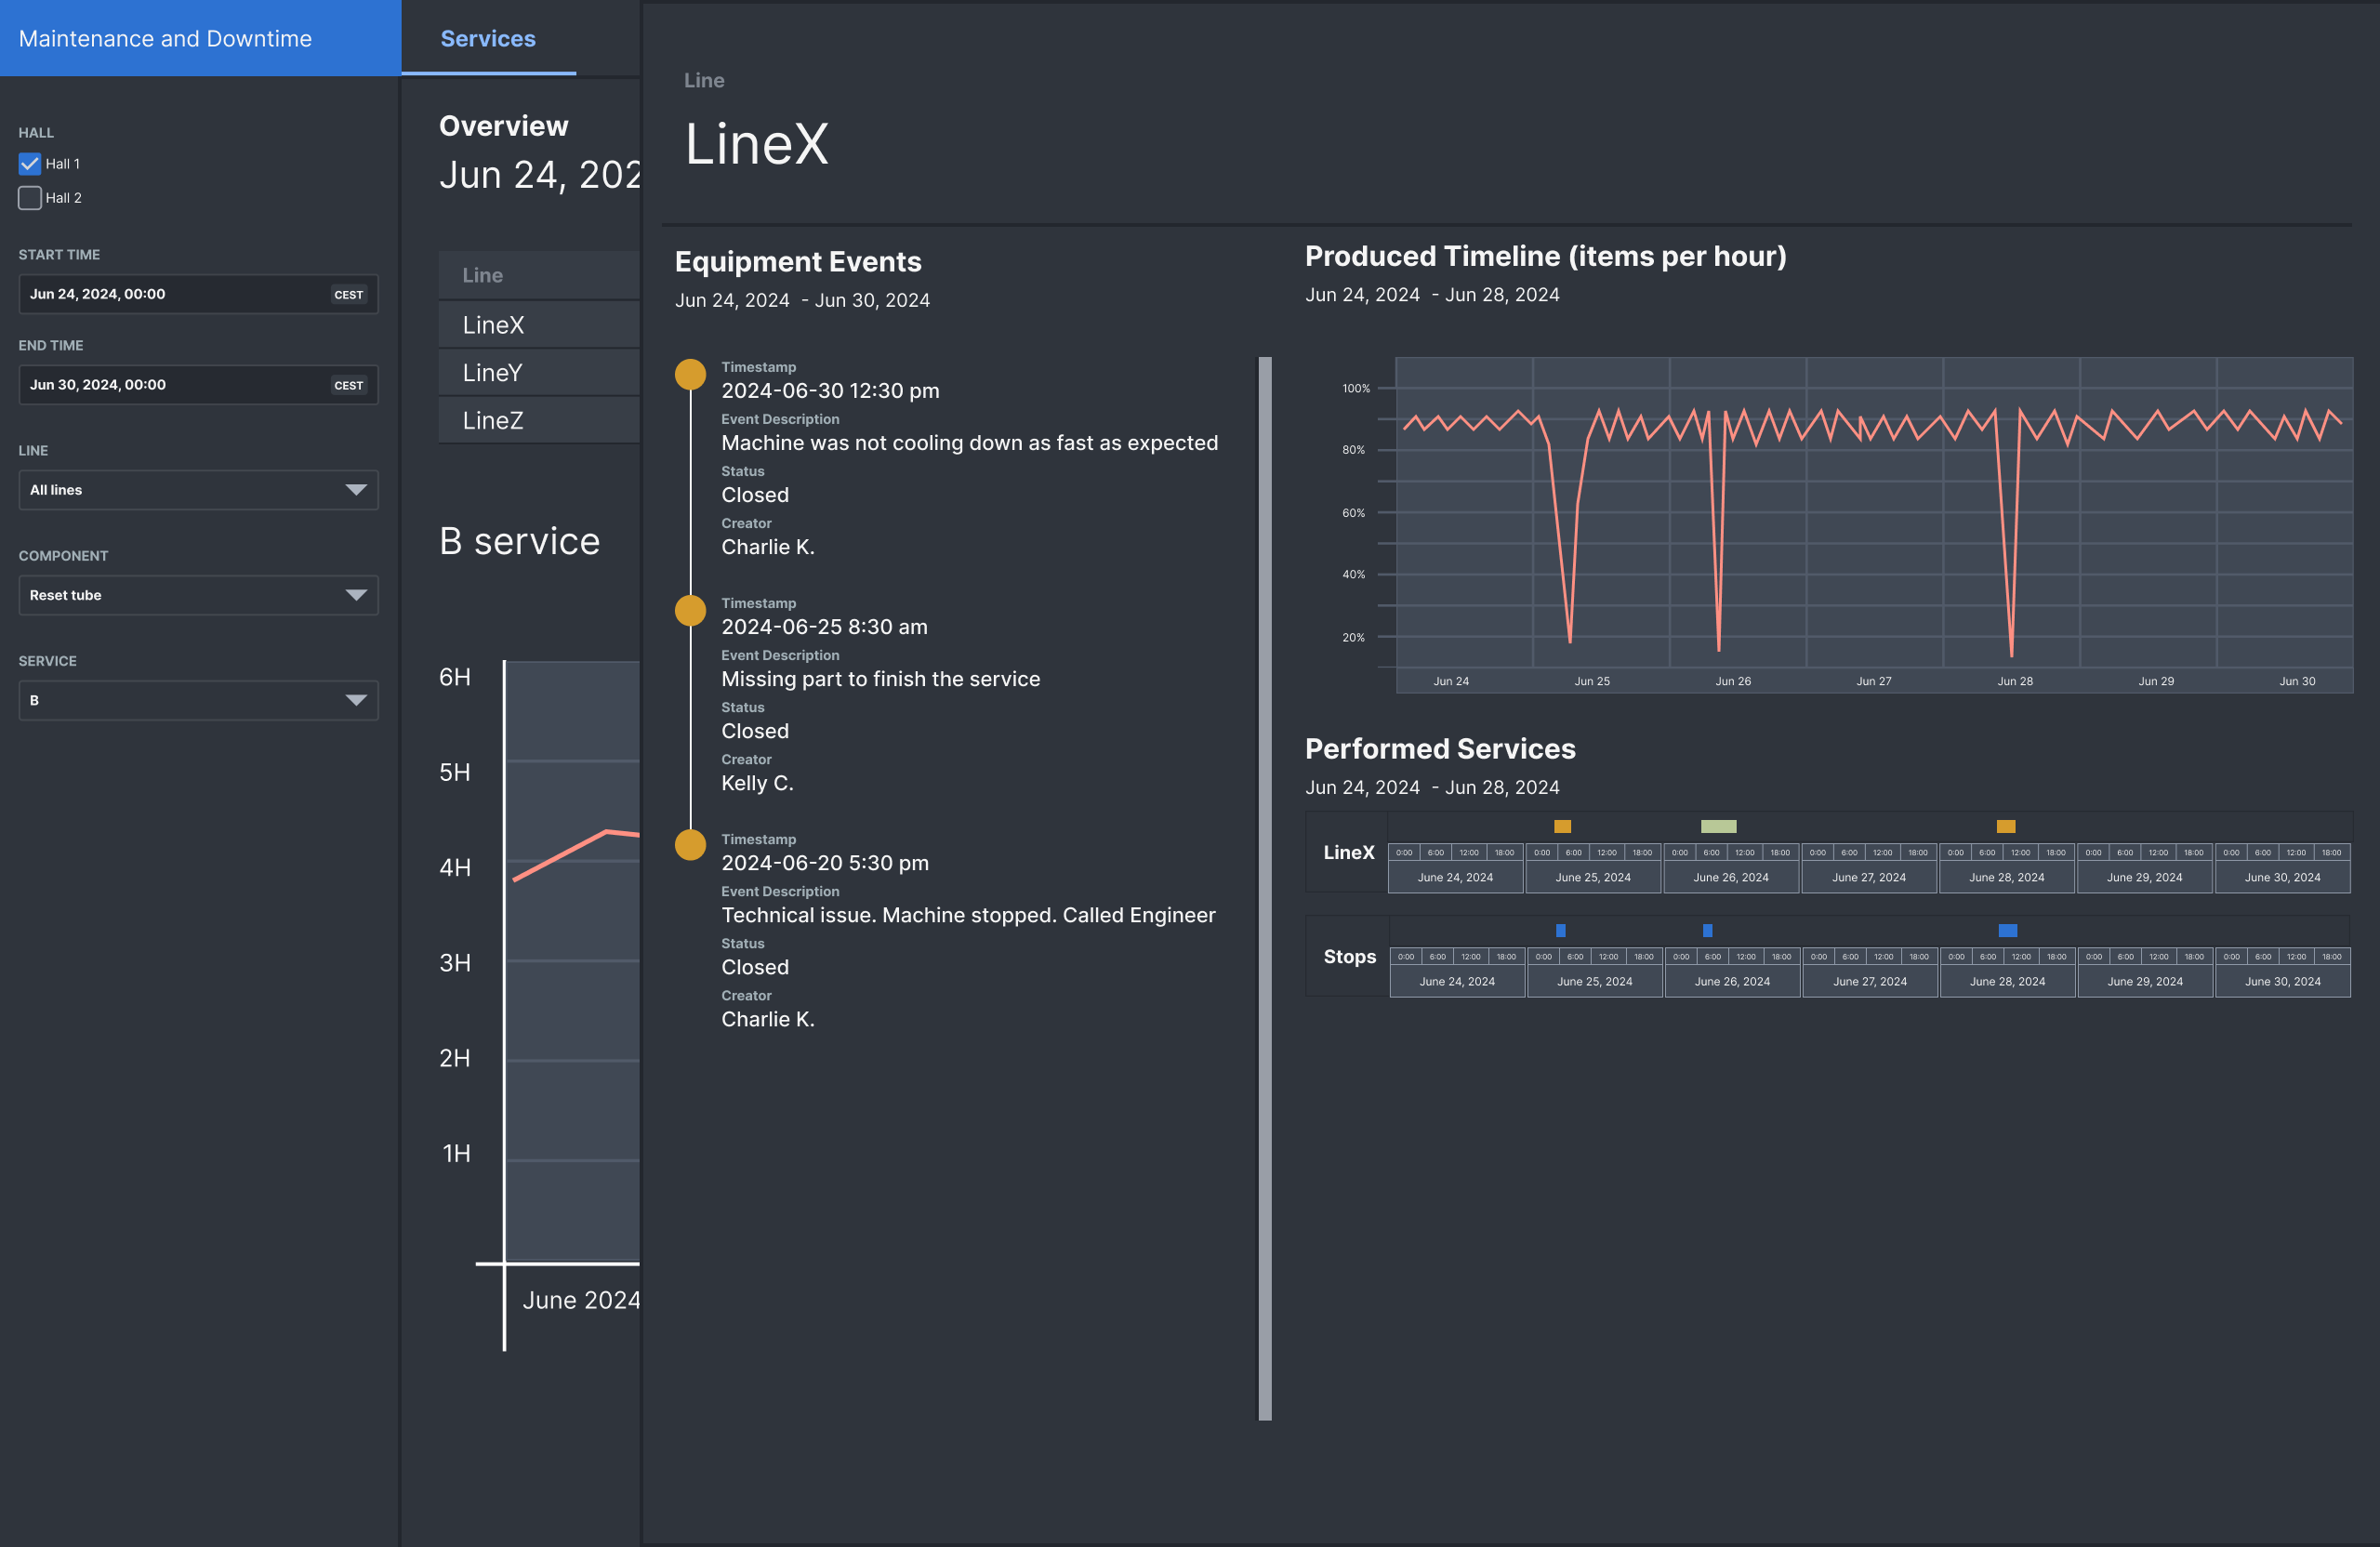
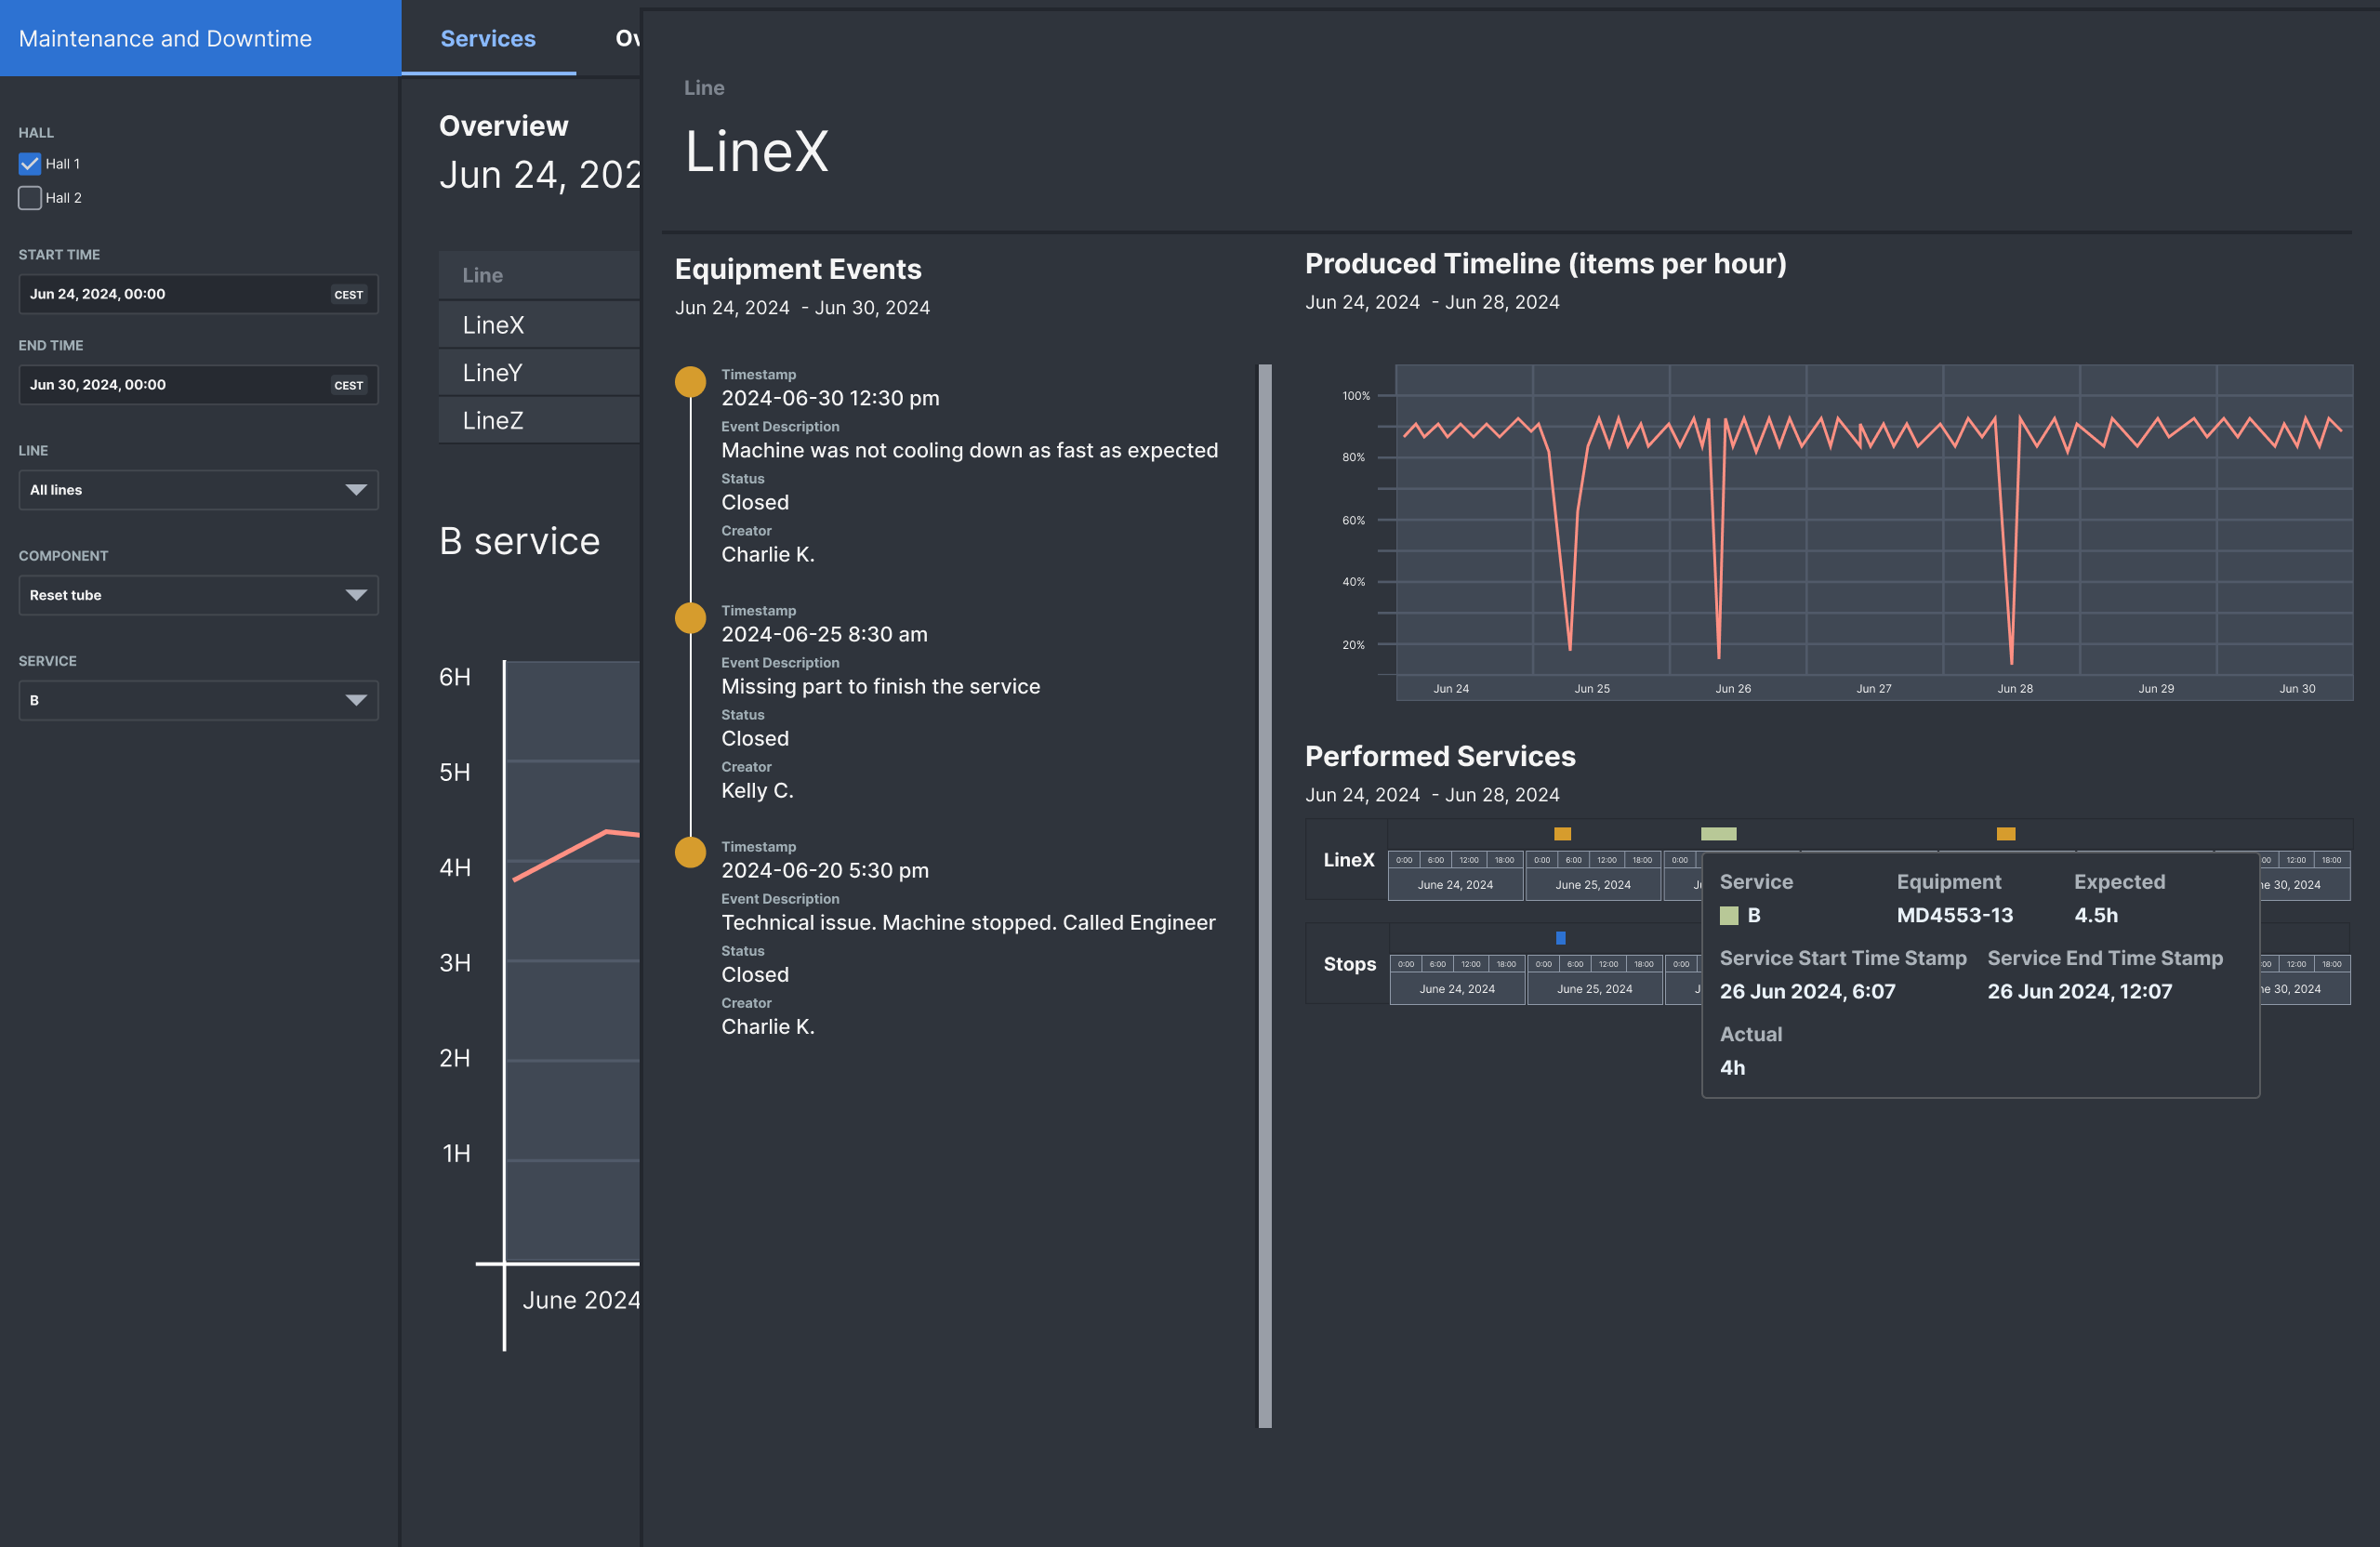
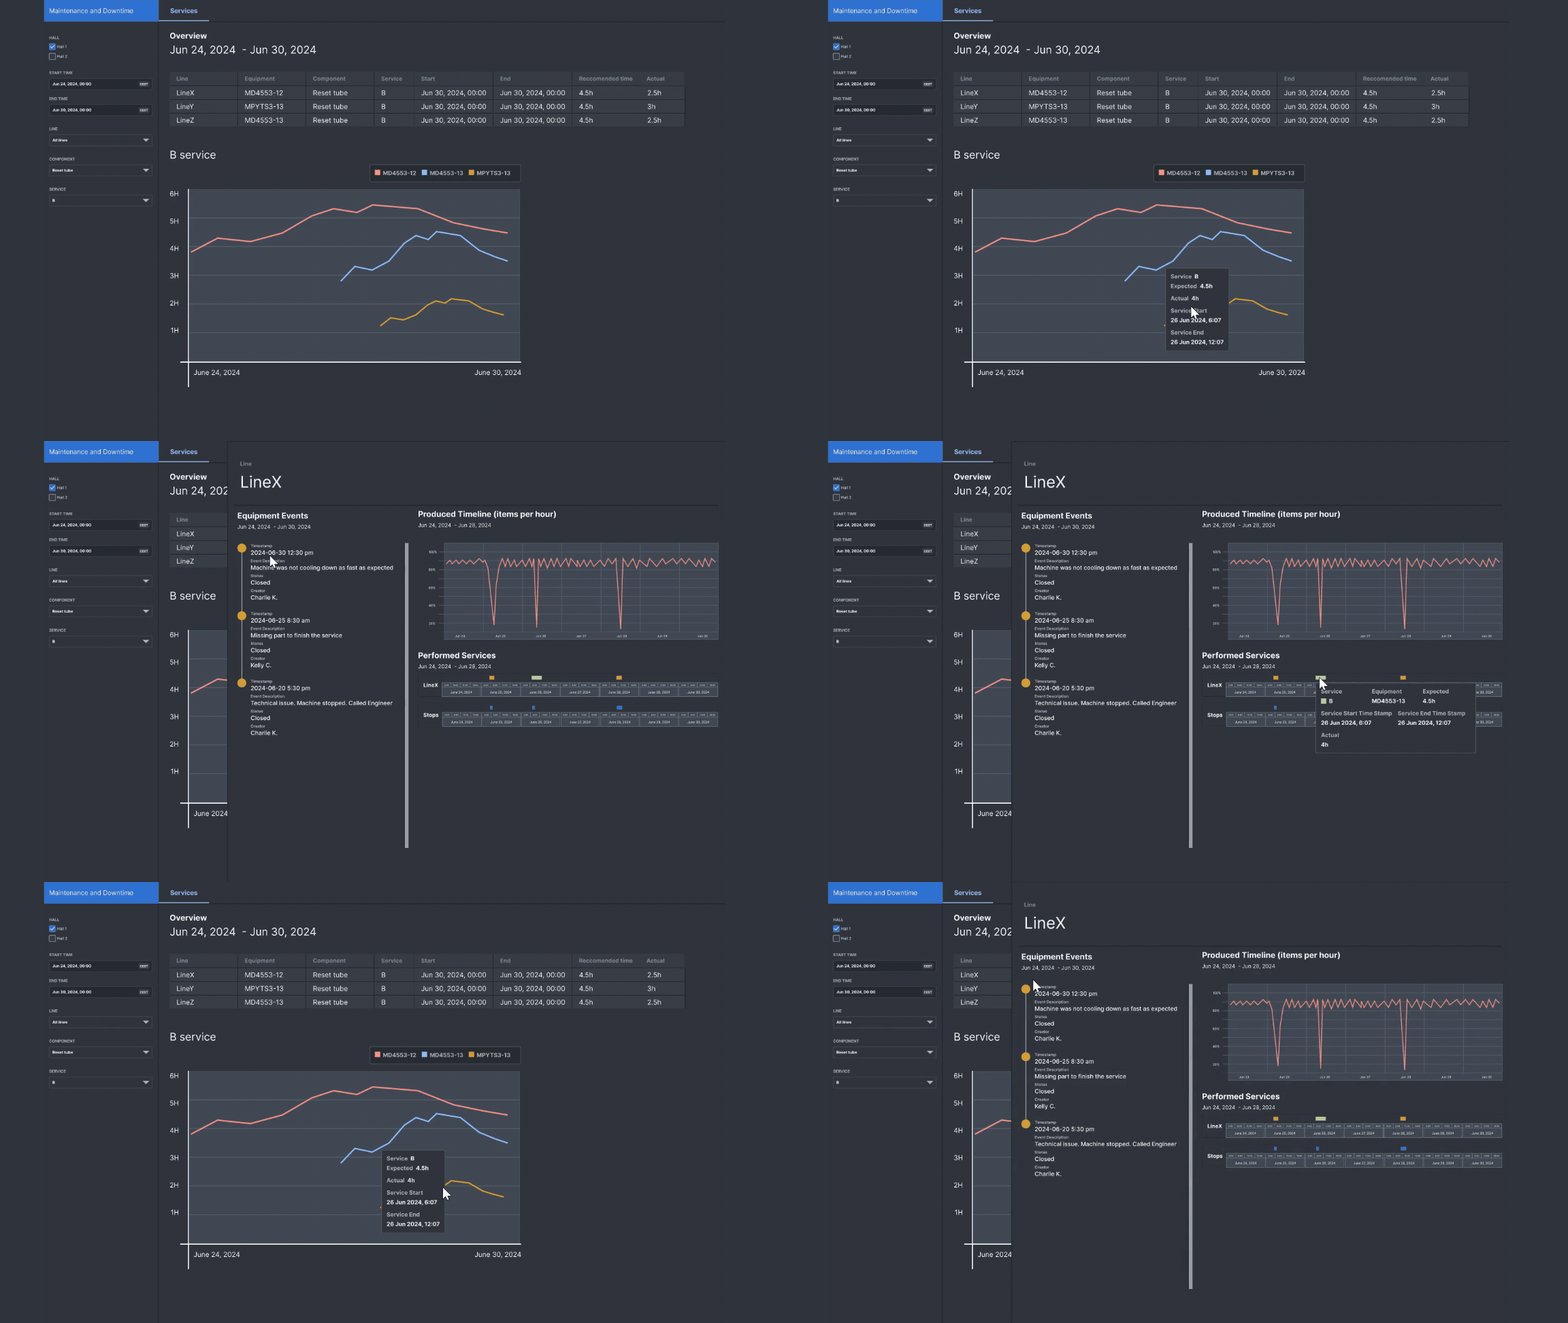
The Services Performance Dashboard triangulates information by providing:
- Duration of Services: Time spent on services performed on the machines.
- Documented Events: Events that were logged and documented.
- Machine Performance Logs: Detailed logs on machine performance metrics.
Features
- Relevant Filters: Filters tailored for LEAN project managers and shop floor managers to investigate weekly service performance.
- Contextual Insights: Additional information provided when services take longer or shorter than expected. For example, any documented events during the services and operational information coming form machines sensors.
Process
360-Degree Qualitative Interviews
- We engaged with all stakeholders including end users, team members, and colleagues working on different data streams to understand the pros and cons of each data source.
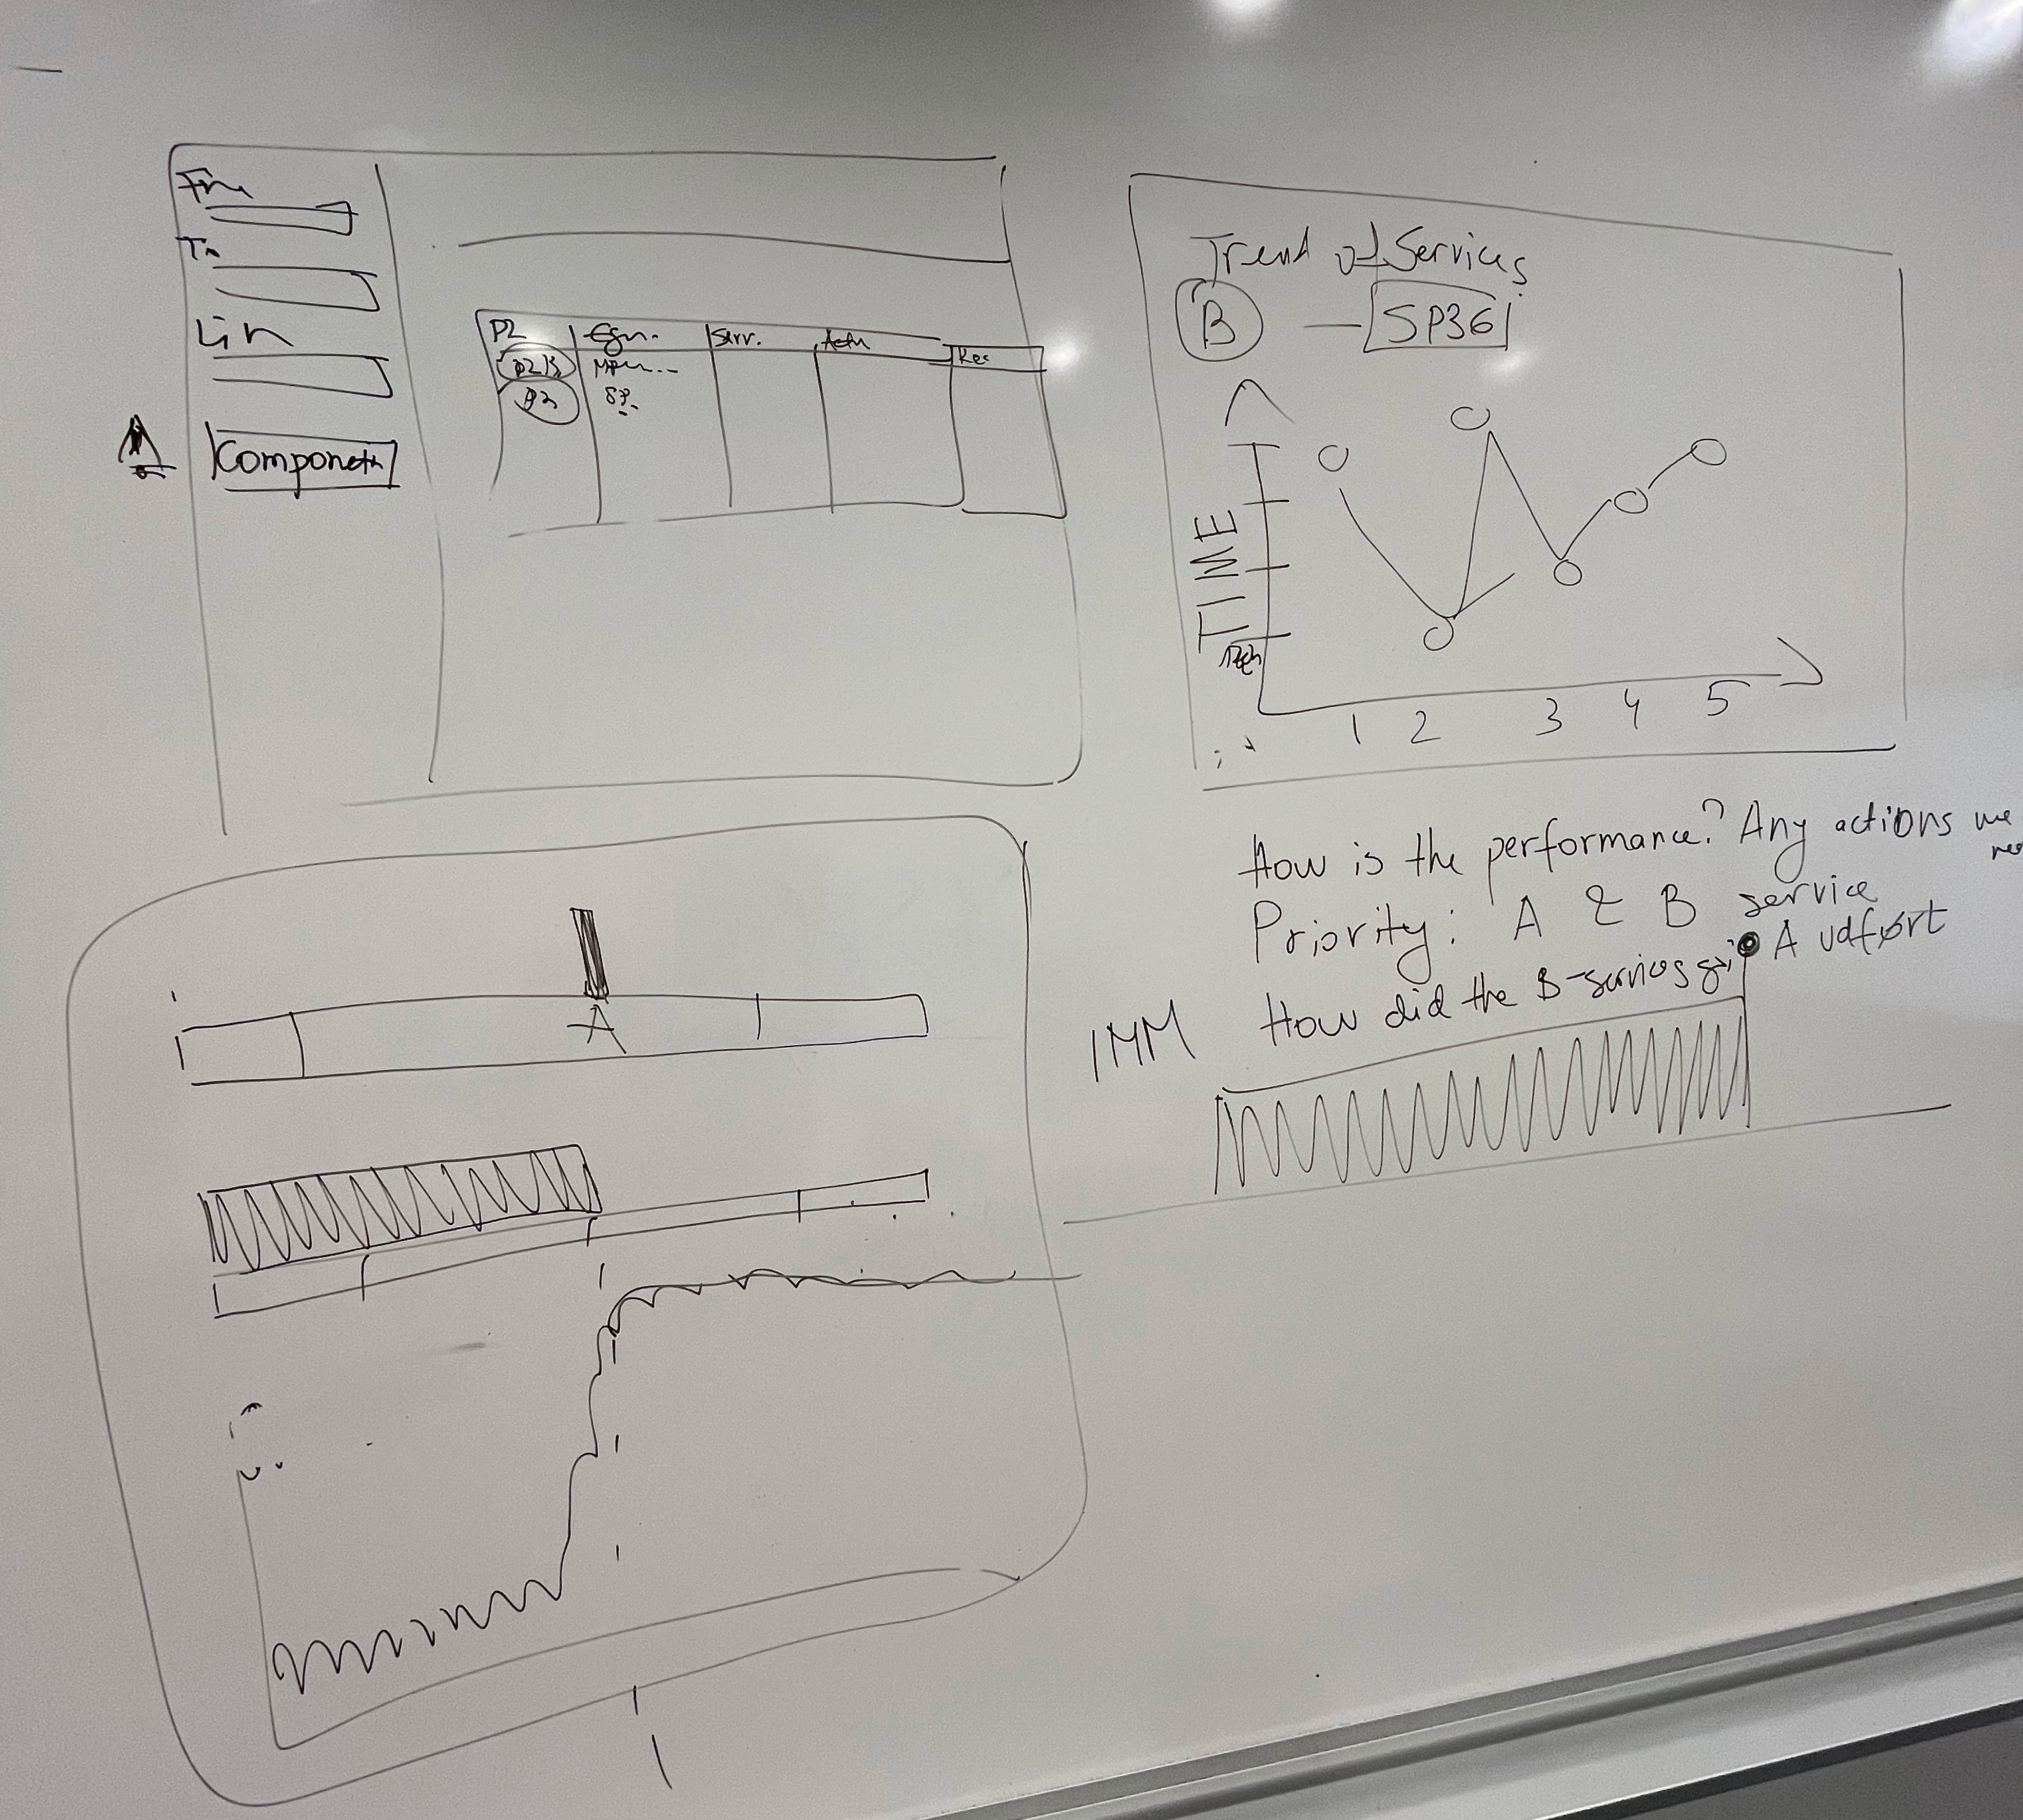
Whiteboard Wireframing
- Initial Drafting: Collaborated with the main stakeholder to draft an initial idea of the required information and set priorities for the first iteration.
Figma Prototype
- Prototyping: Developed a prototype using Figma to visualize the solution and gather feedback.
User Testing
- Stakeholder Feedback: Conducted user testing with shop floor stakeholders to validate and refine the prototype.
Challenges and Process Takeaways
Data vs. Expectations
- Data Accessibility: Faced challenges in obtaining access to data sources and assessing their trustworthiness and timeliness to convey a clear sense of actual downtime.
Solution Space Iterations
- Due to changes in available development tools, the project went through three different solution iterations, each with specific pros and cons. Research and Ideation: Early-stage research and ideation facilitated the development process and provided the team with the flexibility to explore the most viable options.
Last words
The process behind this project underscored the importance of stakeholder engagement, early ideation and prototyping, and the need for exporing the various data sources. The final solution provided a comprehensive tool for LEAN project managers and shop floor managers to monitor and optimize machine services, ultimately aiming to reduce production downtime.
